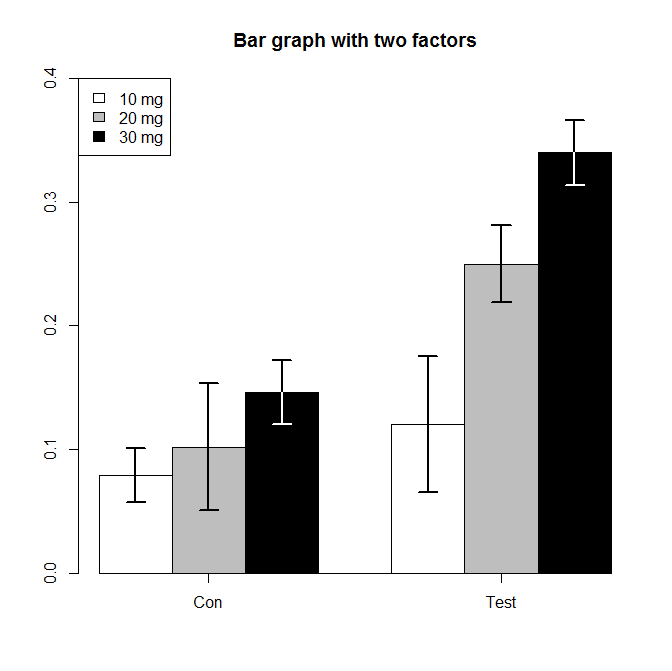
Rで描く、二要因の棒グラフ
barplot(x, beside=T)
- 行列データxを縦列ごとにグループに分けて棒グラフを描く。

#データ入力
group<-c(10,20,30) #例 投与量
m.Con<-c(0.079,0.102,0.146) #対照群 平均値
sd.Con<-c(0.022,0.051,0.026) #対照群 標準偏差

m.Test<-c(0.12,0.25,0.34) #テスト群 平均値
sd.Test<-c(0.055,0.031,0.026) #テスト群 標準偏差


#y軸の最大値を指定
yRoof=round(max(m.Con+sd.Con, m.Test+sd.Test)*1.2, 1)


#棒グラフ
graph1<-barplot(cbind(m.Con, m.Test),beside=T,
        names=c("Con","Test"), ylim=c(0,yRoof), col=c(0,8,1))

#上向きのエラーバー
arrows(graph1,cbind(m.Con,m.Test),
       graph1, cbind(m.Con+sd.Con,m.Test+sd.Test),
       angle=90, length=0.1,lwd=2, col=1)

#下向きのエラーバー
arrows(graph1,cbind(m.Con,m.Test),
       graph1,cbind(m.Con-sd.Con, m.Test-sd.Test),
       angle=90,length=0.1,lwd=2,col=c(1,1,"white"))

# x軸を描く
axis(side=1, c(mean(graph1[,1]),mean(graph1[,2])), labels=F)

legend("topleft", paste(group, "mg"), fill=c(0,8,1)) #凡例
title("Bar graph with two factors")
データ
- cbind(m.Con,m.Test)#ベクトルを列方向に連結。
| m.Con | m.Test | ||
| [1,] | 0.079 | 0.079 | #10mg |
| [2,] | 0.102 | 0.102 | #20mg |
| [3,] | 0.146 | 0.146 | #30mg |
- Conの平均値(m.Con)1、2、3行目がグラフ1グループ目に隣接して表示される。
barplot(beside=T)
- 入力されたベクトルを列ごとに隣接して描画。
- besides=Fにすると列ごとの積み上げグラフになるので注意。
- barplot()を代入したgraph1は、各棒のx軸上の位置を値として返す。入力した表と同じ形式が出力される。
エラーバー
- arrows()も同様に列ごとに1、2、3行目とデータが読み込まれるので、同じ形式でx0,y0.x1,y1のそれぞれにデータ表を指定する。(値の混同がないように注意すること)
そのほかの修飾
- 各郡の真ん中に目盛りをつけるため、axis()には、graph1の列ごとに平均値をとった。(各棒それぞれに目盛りをつける場合、graph1をそのまま入力する)
- legend(位置、ラベル名、凡例の書式)を指定する。すべてに同じ単位をつける場合、paste()が便利。
行列を入れ替えた表

データ表の行列を入れ替えて入力する
rbind(m.Con, m.Test) #ベクトルを行方向に連結
| [,1] | [,2] | [,3] | |
| m.Con | 0.079 | 0.102 | 0.146 |
| m.Test | 0.120 | 0.250 | 0.340 |
| group | 10 | 20 | 30 |
#棒グラフ
graph1<-barplot(rbind(m.Con, m.Test),beside=T,
        names=group, ylim=c(0,yRoof), col=c(0,8))

#上向きのエラーバー
arrows(graph1,rbind(m.Con,m.Test),
       graph1, rbind(m.Con+sd.Con,m.Test+sd.Test),
       angle=90, length=0.1,lwd=2)

#下向きのエラーバー
arrows(graph1,rbind(m.Con,m.Test),
       graph1,rbind(m.Con-sd.Con, m.Test-sd.Test),
       angle=90,length=0.1,lwd=2)

# x軸を描く
axis(side=1, c(mean(graph1[,1]),mean(graph1[,2]),mean(graph1[,3])), labels=F)

#凡例とタイトル
legend("topleft", c("Con","Test"), fill=c(0,8))
title("Bar graph with two factors")
- barplot()に入力するデータ表にあわせてarrows(),axis()の入力データの形式をそろえる。